This case study is password protected
Enter your personal password below, or request access if you don't have one yet.
That password isn't right — try again, or request access below.
Request access →The minutes around a fault, on the page that reports it
Context
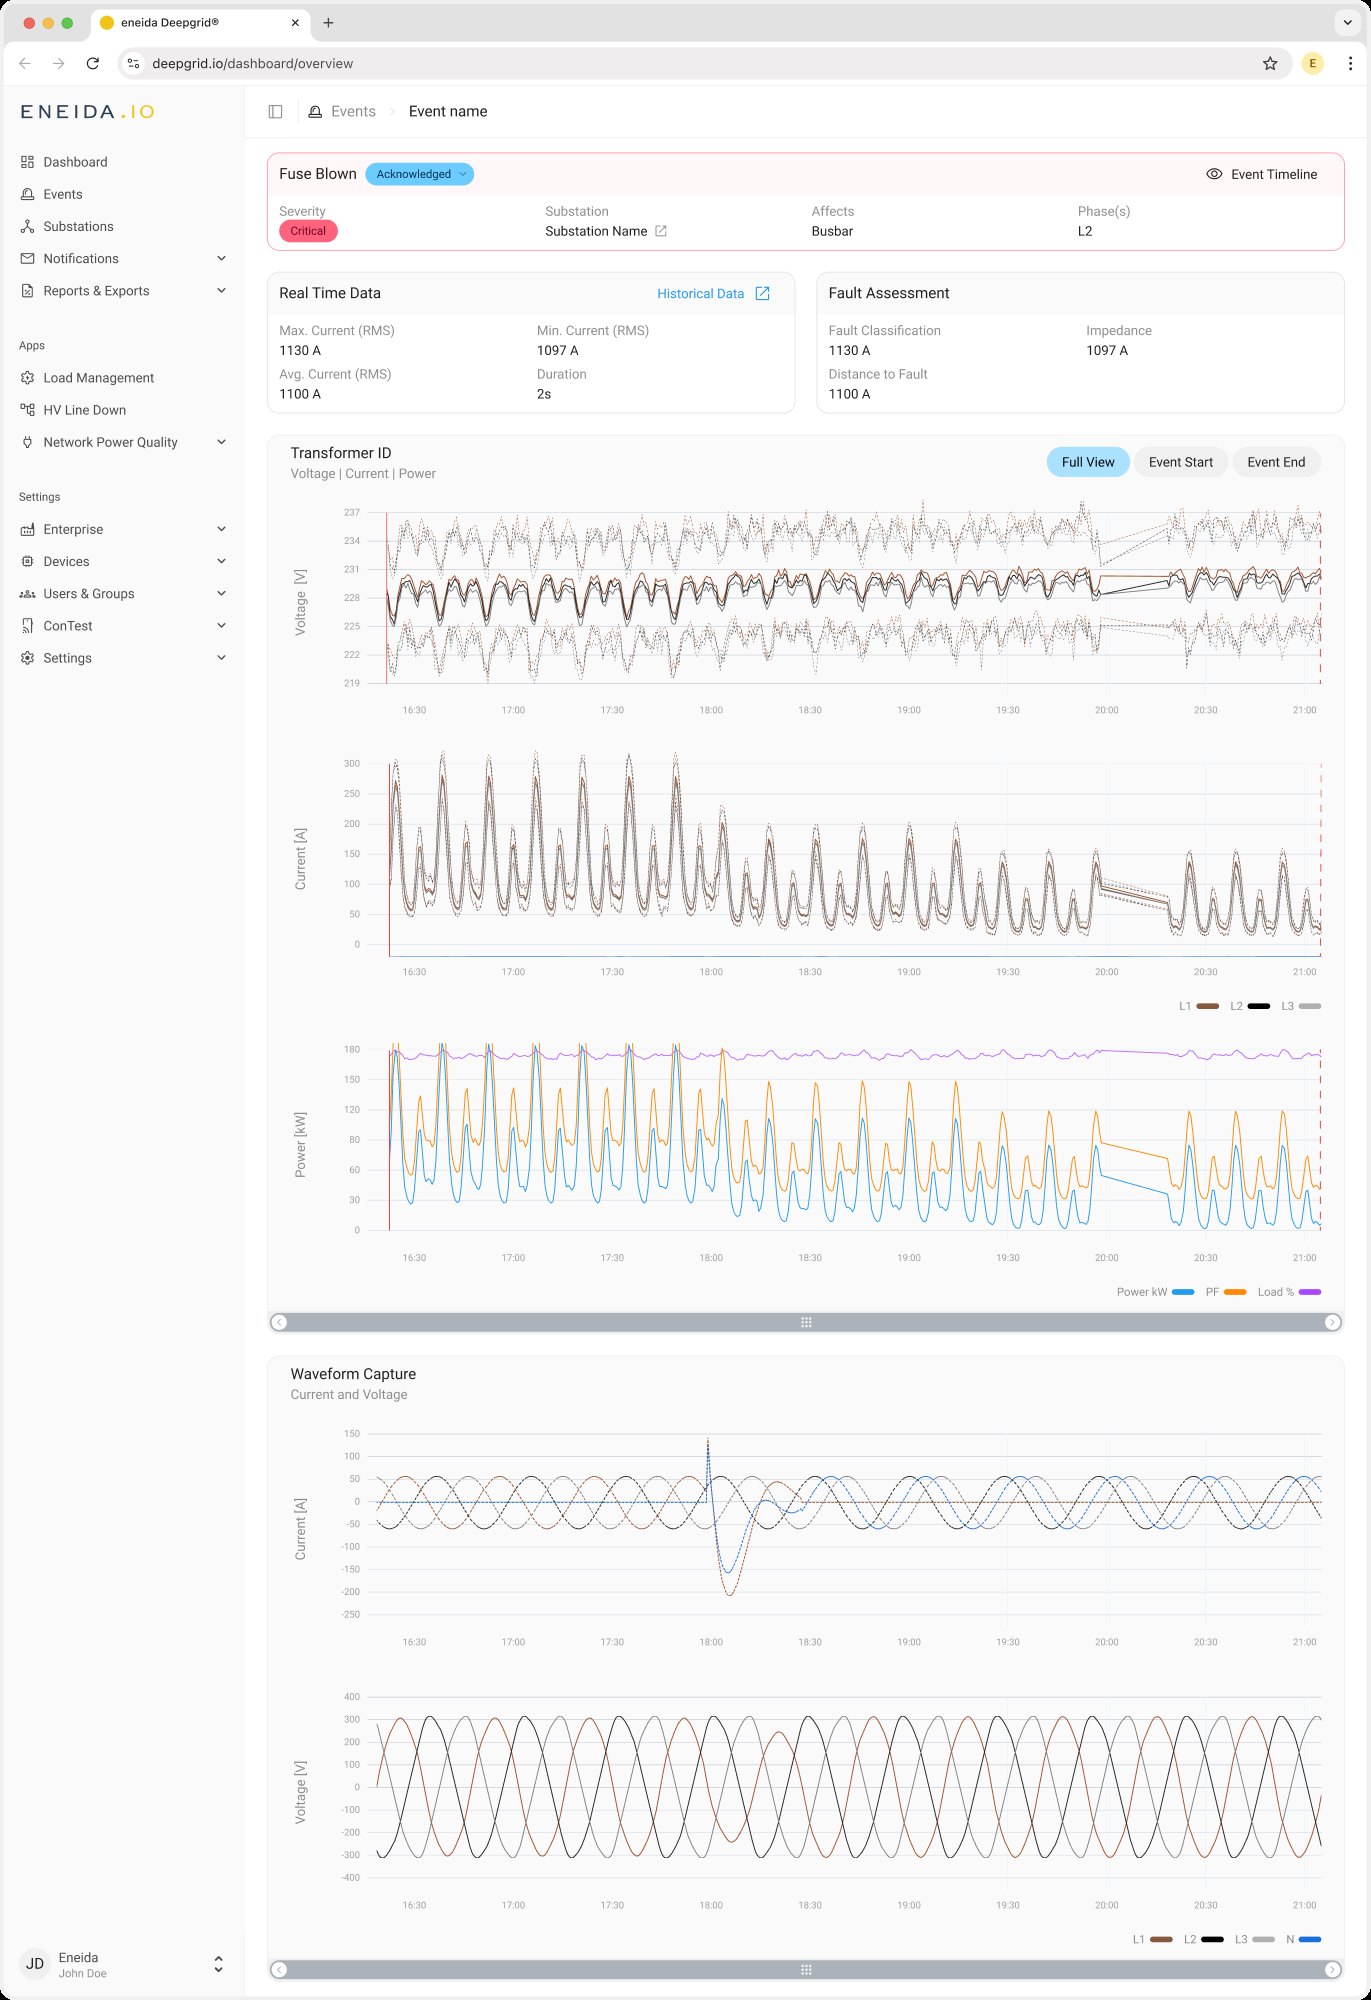
DeepGrid raises events when something goes wrong on the low-voltage network: a fuse blows, a feeder overloads, voltage leaves its band. Each event opens on a details page with a header, a Real Time Data card and a Fault Assessment card. The raw waveform sat in a separate tab.
Those cards answer "how big was it?". They don't answer the question an operator asks next: what was the network doing before it happened, and did it recover afterwards?
Problem
To see the electrical picture around an event, operators had to leave the page or export the data and plot it themselves. There was no voltage, current or power trend before or after the event, and even with one, the event start and end are two single instants inside hours of data.
"I want to see voltage, current and power plots on the event details page, so that I can understand the electrical context around an event without leaving the page or exporting data."
Goals
Show context without leaving the page. Voltage, current and power sit on the event page itself, above the waveform.
Read three quantities as one moment. All plots share one time axis and zoom and pan together, so a dip in voltage lines up with the current spike under it.
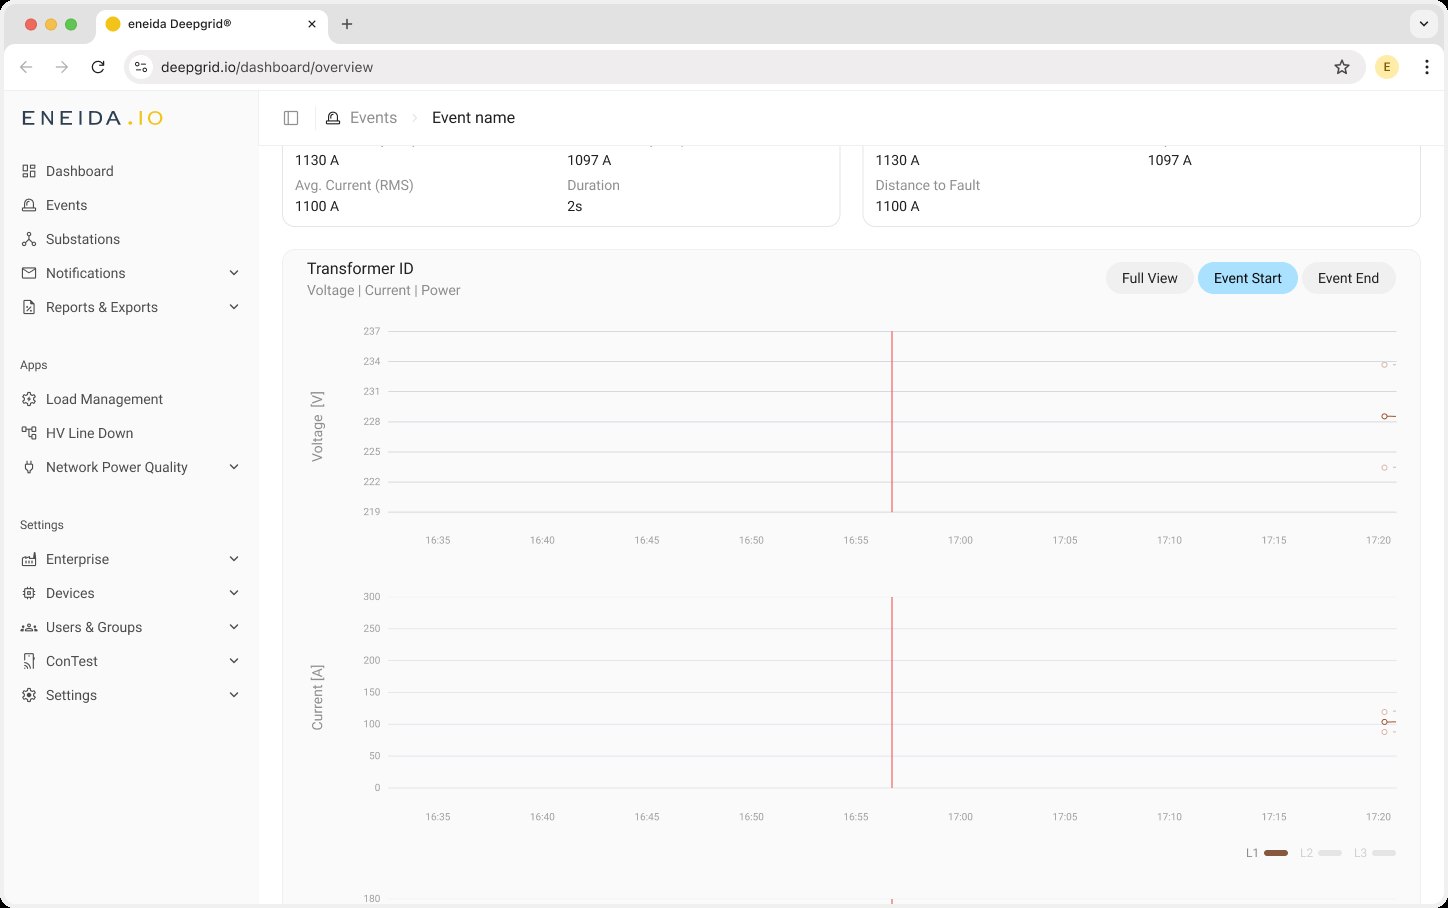
Get to the event in one click. Shortcuts zoom every plot to the event start or end. Full view is the default on load.
Show the spread, not just the average. Voltage and current per phase as avg · max · min; power with active power, load and power factor.
Never rely on colour alone. Phases and statistics have to be told apart without colour, and shortcuts reachable by keyboard.
Approach
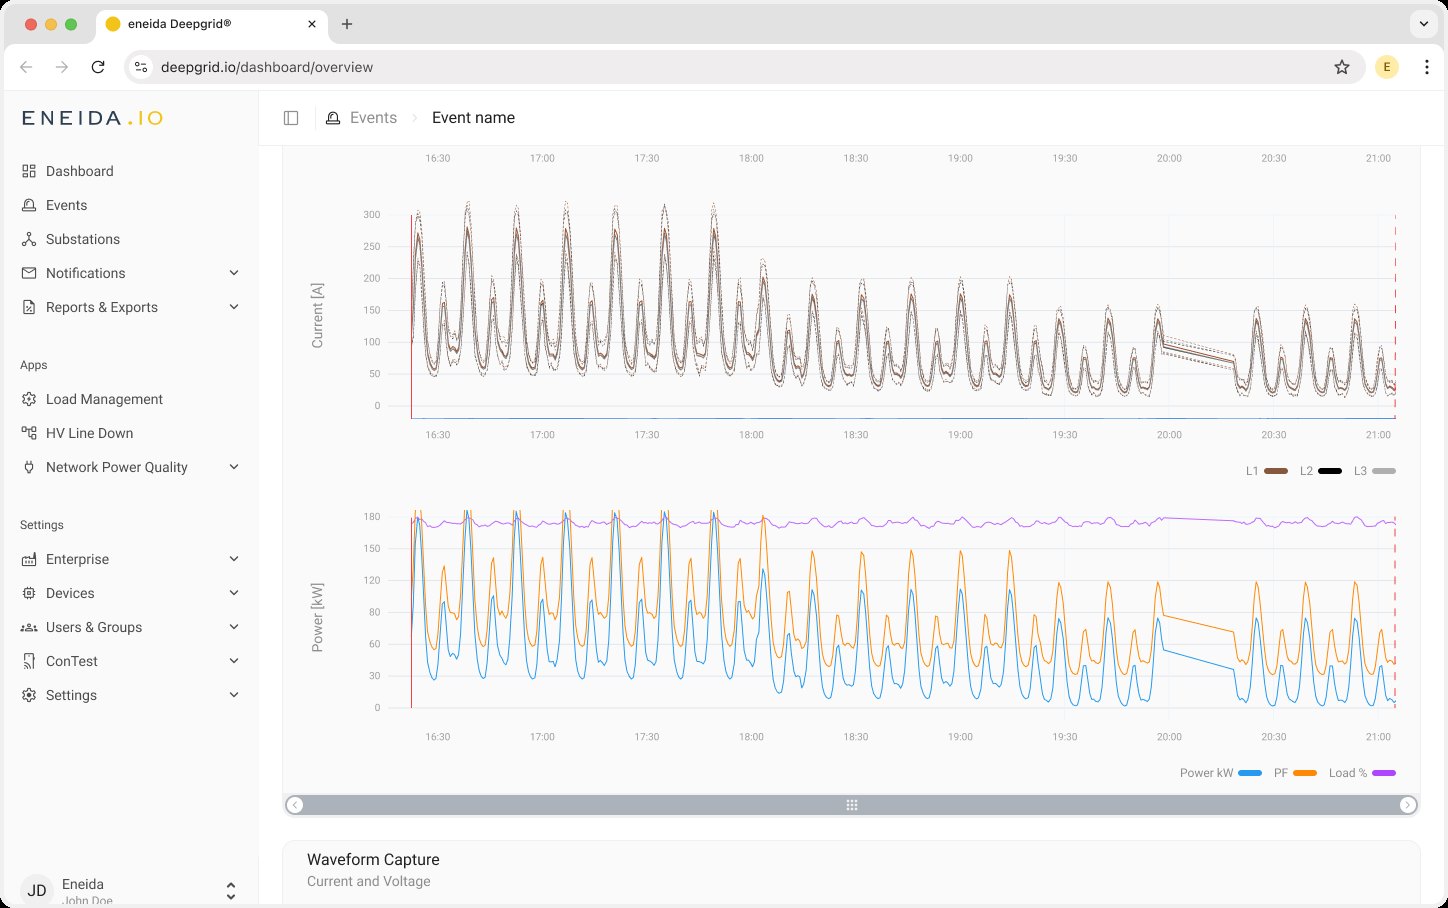
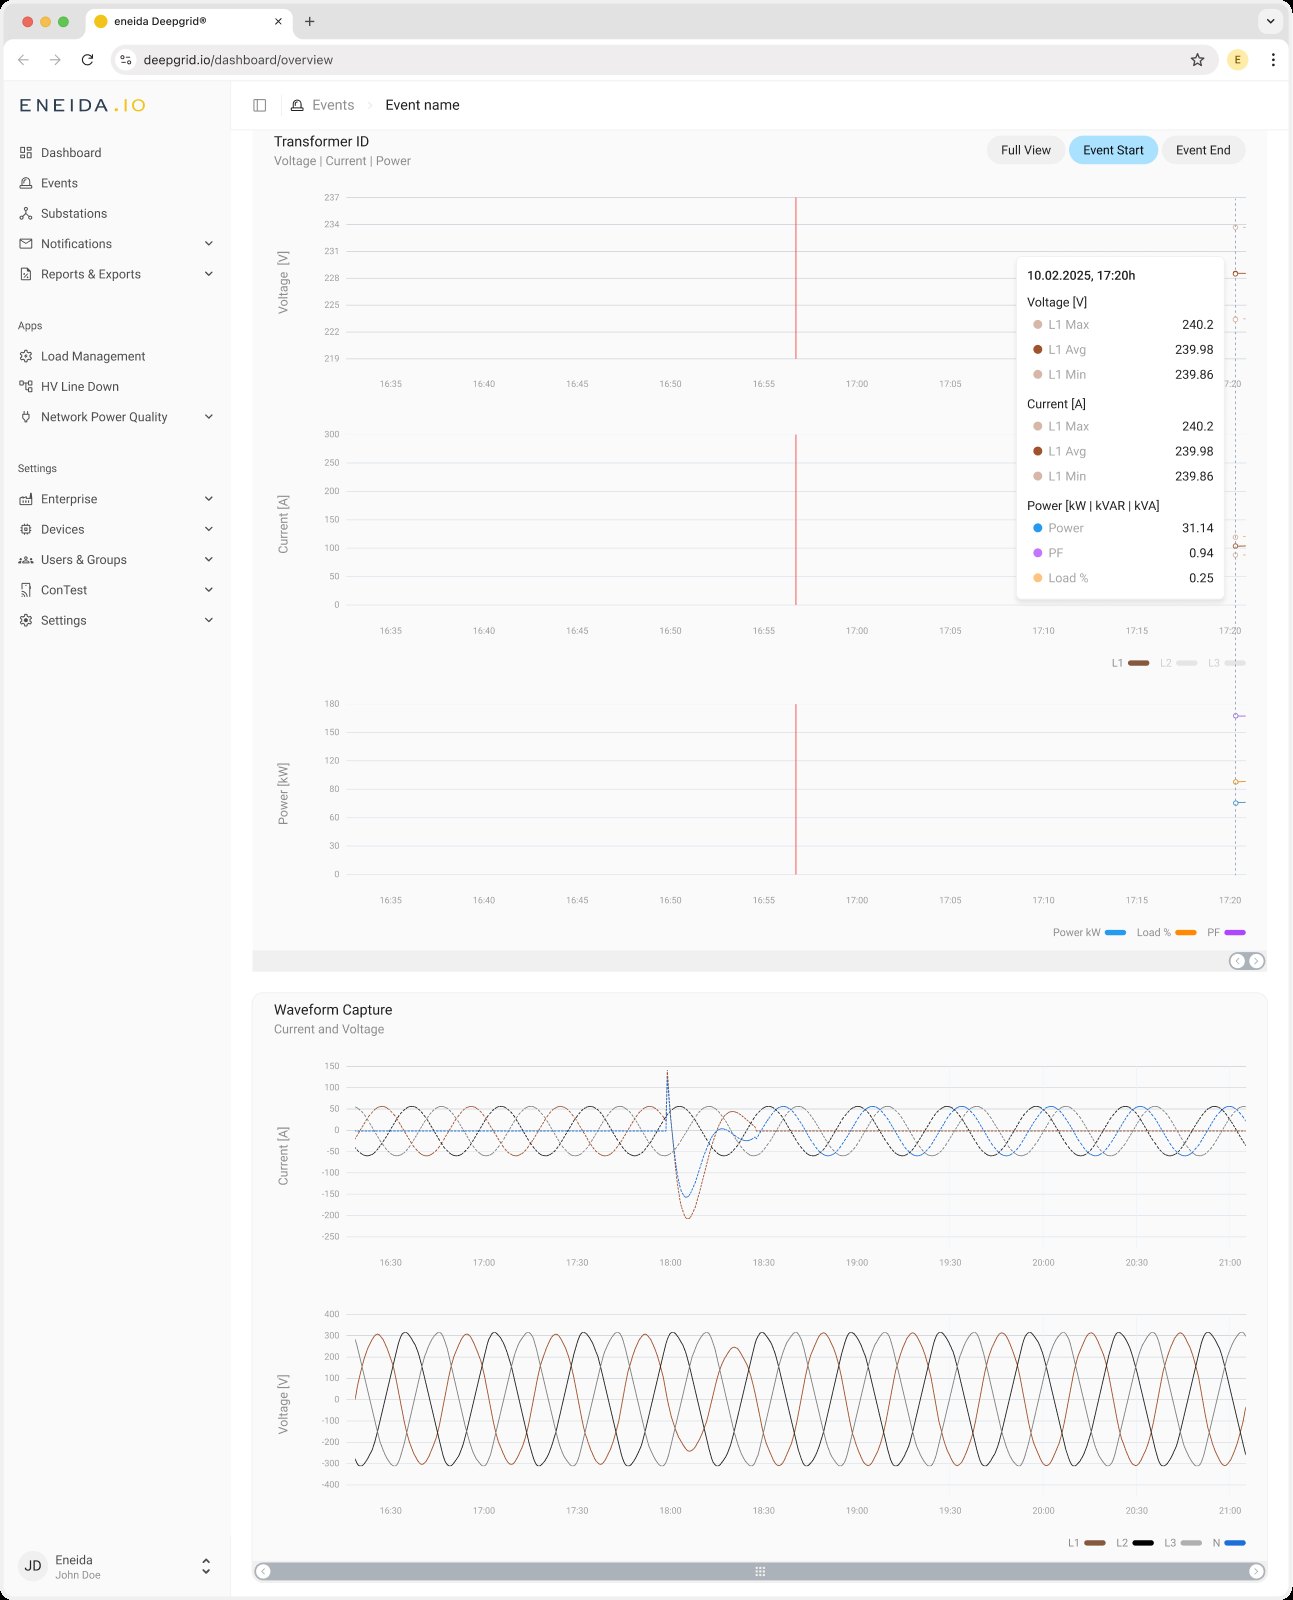
One card, three charts, one scroll bar. Voltage, current and power stack inside a single Transformer card on a shared time axis. Because the axes are linked, one scroll bar sits under the group: three brushes would only ever move together.
Two moments get their own button. A segmented control in the card header — Full View, Event Start, Event End — zooms every chart at once to a short window around that moment. Panning clears the selection, so the control never claims a view the user has left. The start is a solid red line, the end a dashed one.
One cursor, one tooltip, three charts. Hovering any chart drops a cursor through all three and opens one tooltip grouped by quantity under a single timestamp, instead of three pop-ups to hunt across.
Line style says which statistic, colour says which phase. Within a phase the average is solid and max and min are dashed, so avg · max · min stay readable without three more colours. The legend doubles as a filter for hiding phases.
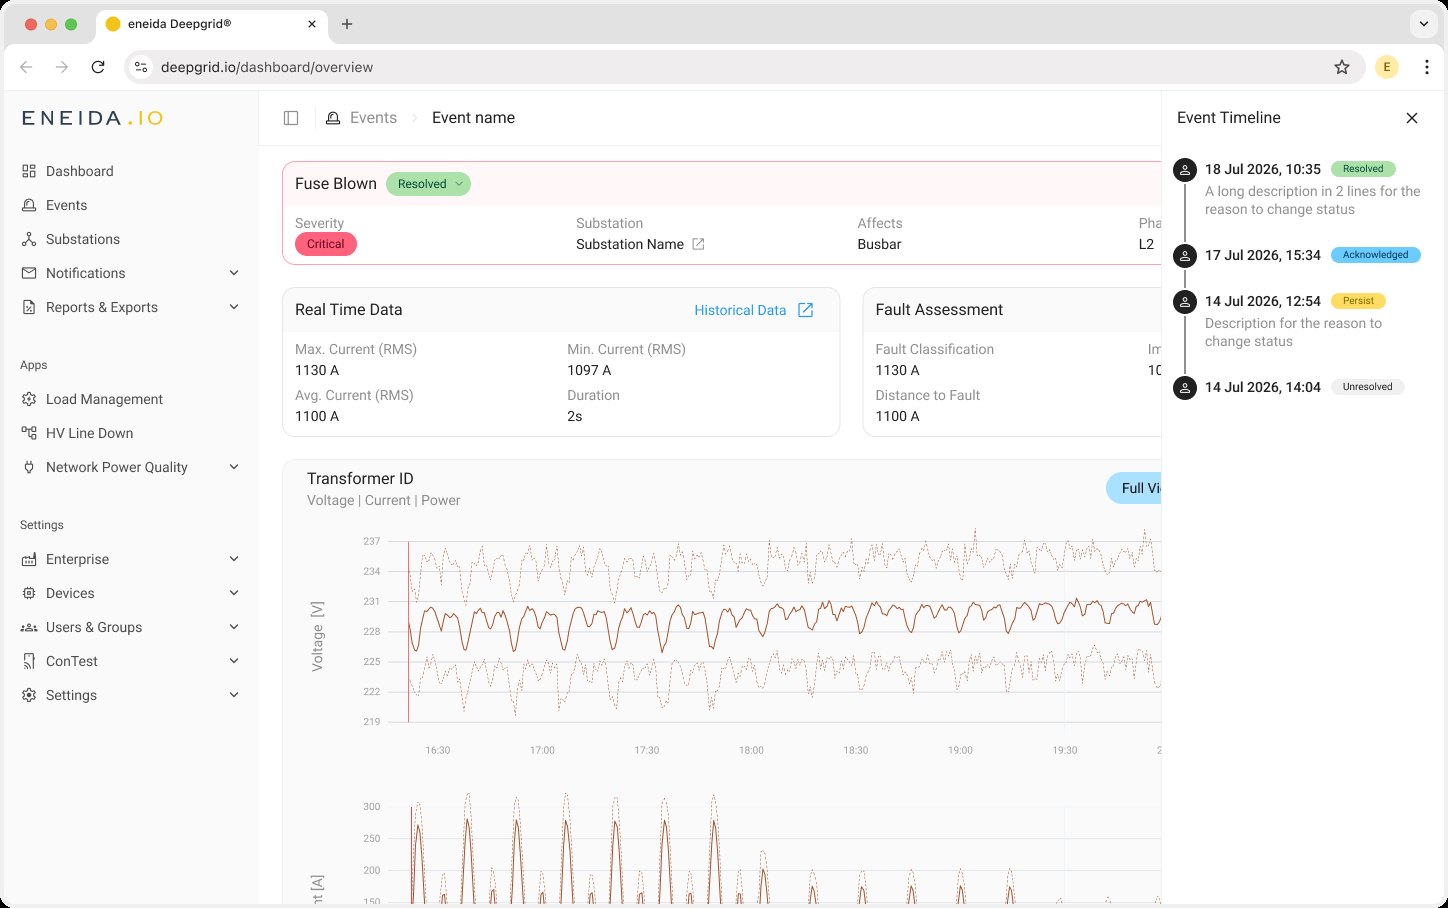
Context first, waveform second. The plots sit under the summary cards and above the Waveform Capture, which moved from its own tab onto the same page: headline numbers, then the hours around the event, then the cycles of the fault itself.
Beyond the brief
The ticket was about charts. Fitting them showed the page around them was doing too much in too many places, so three more changes went into the same handoff.
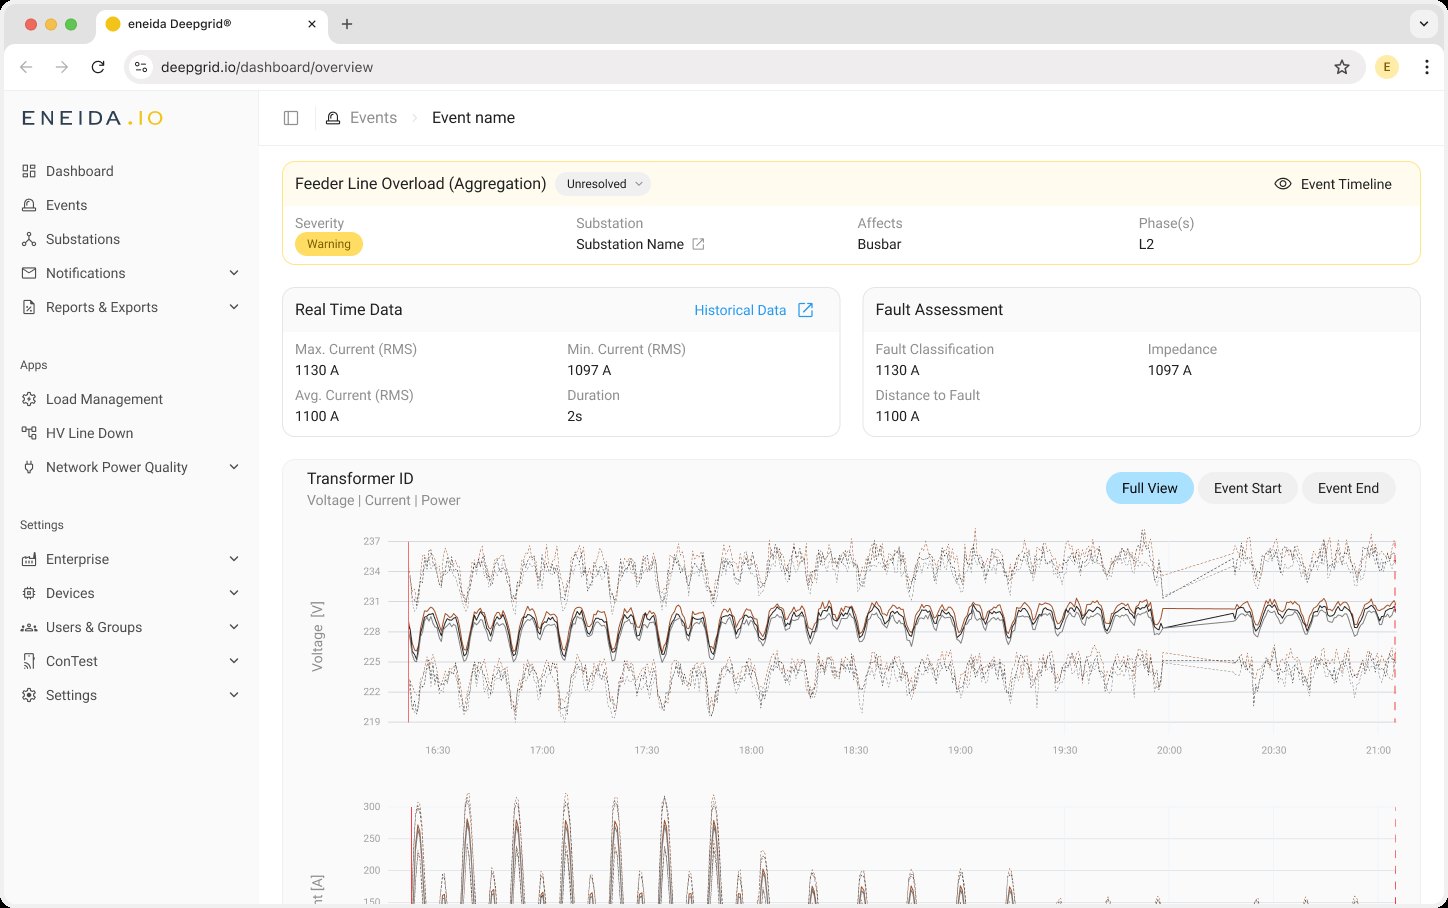
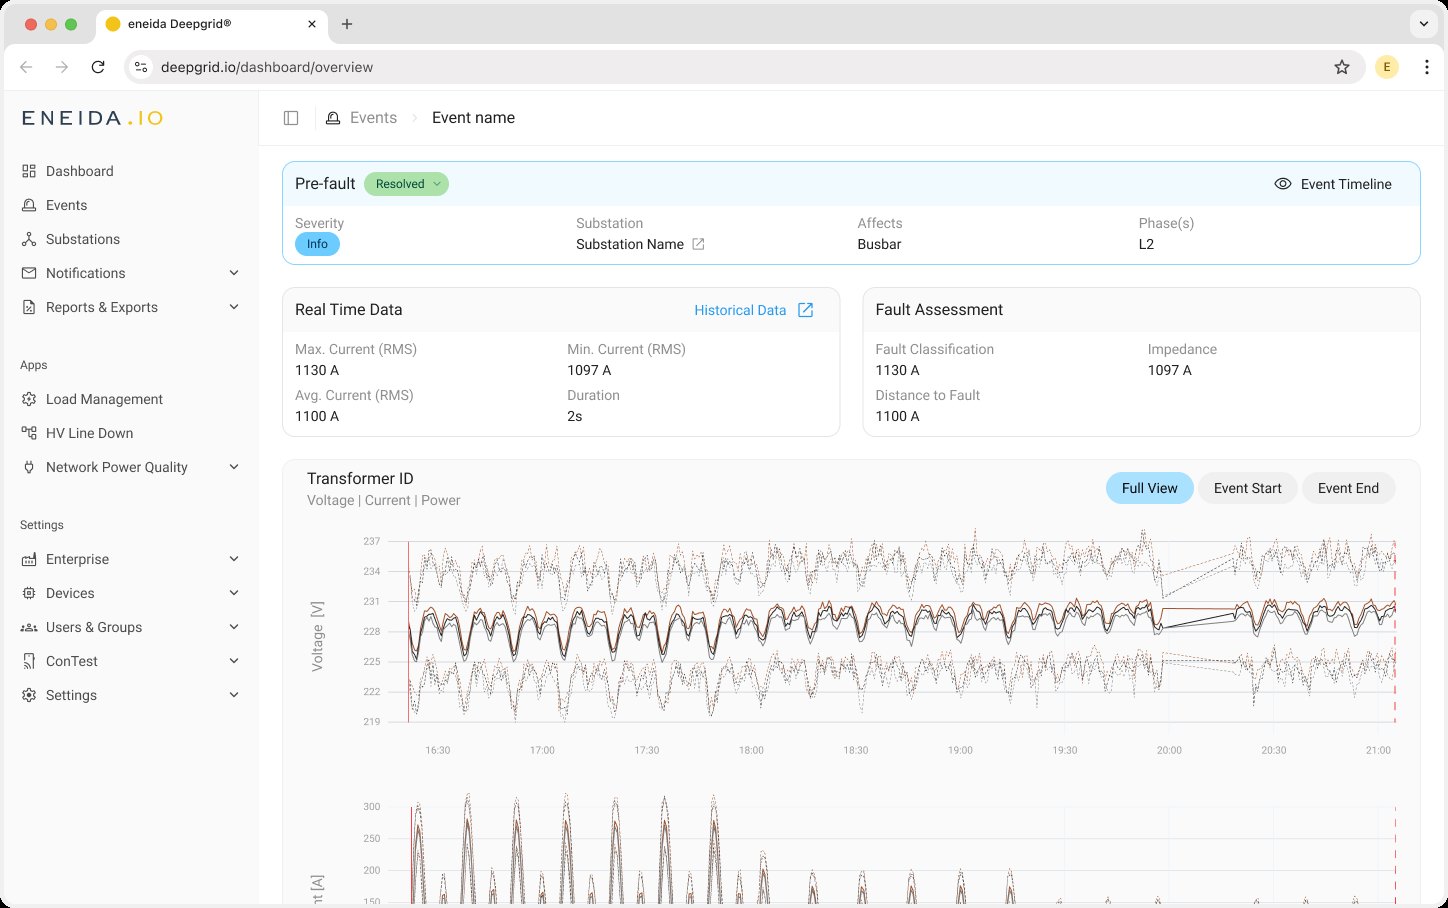
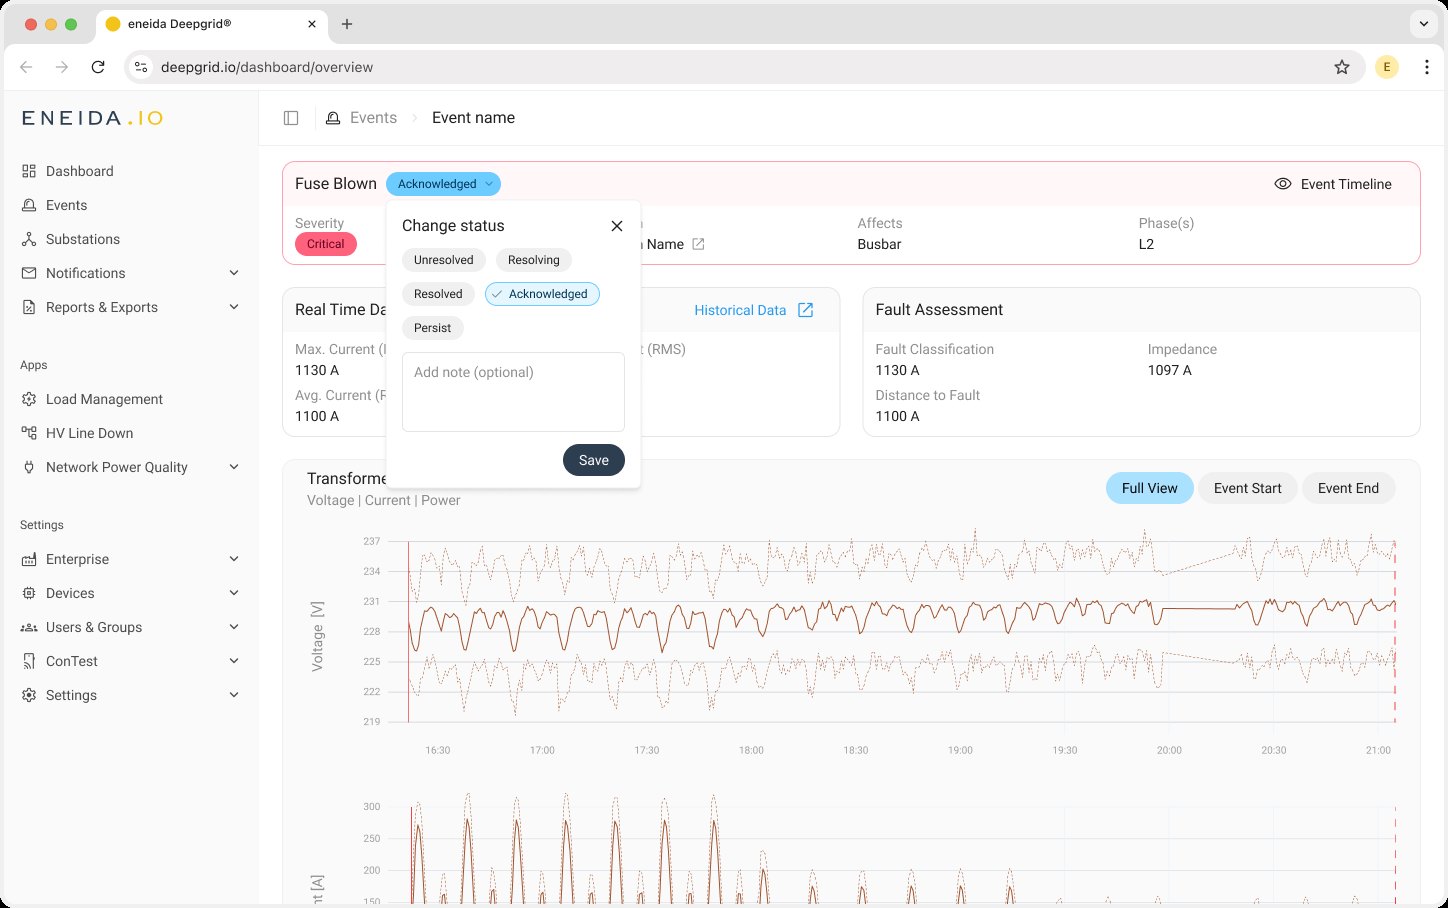
Severity sets the colour of the header. Red for Critical, yellow for Warning, blue for Info. The severity chip still names it in words, so colour is a cue and never the only signal.
Change status where you read it. The status chip next to the event type is now the control: it opens a small popover to pick a status and add an optional note.
The timeline steps aside. The event history moved from a permanent sidebar into a drawer behind an Event Timeline button, and the summary cards moved side by side, giving the plots the full width of the page.
Final design
Severity and status at the top, the numbers next, then the hours around the event and the fault itself. The history is one click away instead of taking a column.