This case study is password protected
Enter your personal password below, or request access if you don't have one yet.
That password isn't right — try again, or request access below.
Request access →The whole sensor fleet, read in one scroll
Context
DeepGrid runs on sensors installed across the low-voltage network. The Device Management area already listed them one by one, but there was no single place to answer the questions an asset manager starts the day with: how big is the fleet, how much of it is installed, how much of it is reporting, and is commissioning keeping pace?
The ticket arrived with a mock that had already worked out what to show: fleet composition, connectivity, health, commissioning activity and installation outcomes, each with its counting rules spelled out. My job was the how, in DeepGrid's own look and design system components.
Problem
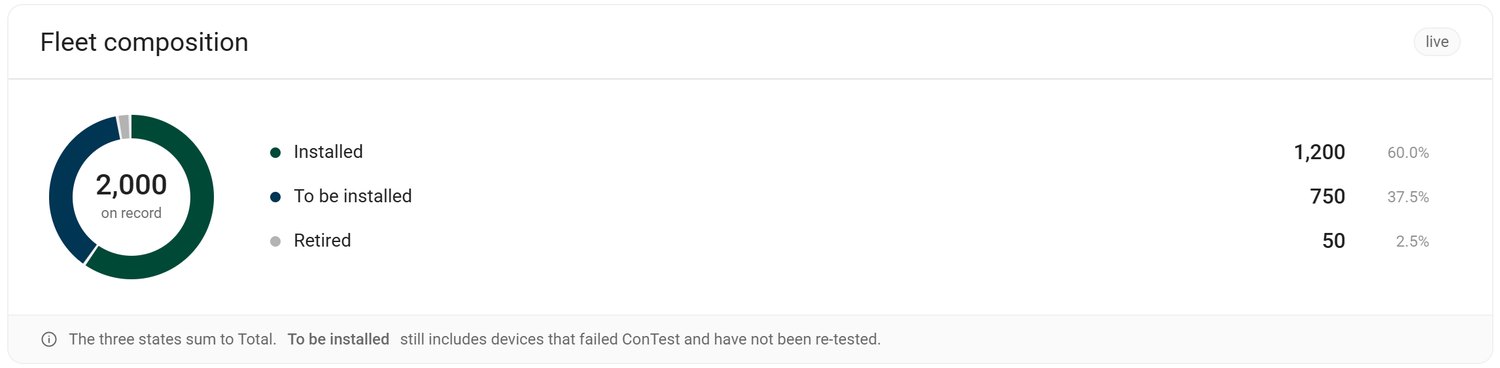
The mock drew three of its five blocks as rings, and its own notes argued against them twice. Connectivity had "no ring here on purpose" because its sets overlap, and the health ring had to draw its problem slices thicker because at 3% they were otherwise unfindable. On a page where most problems are 1–4% of the fleet, the chart type was hiding the numbers that mattered.
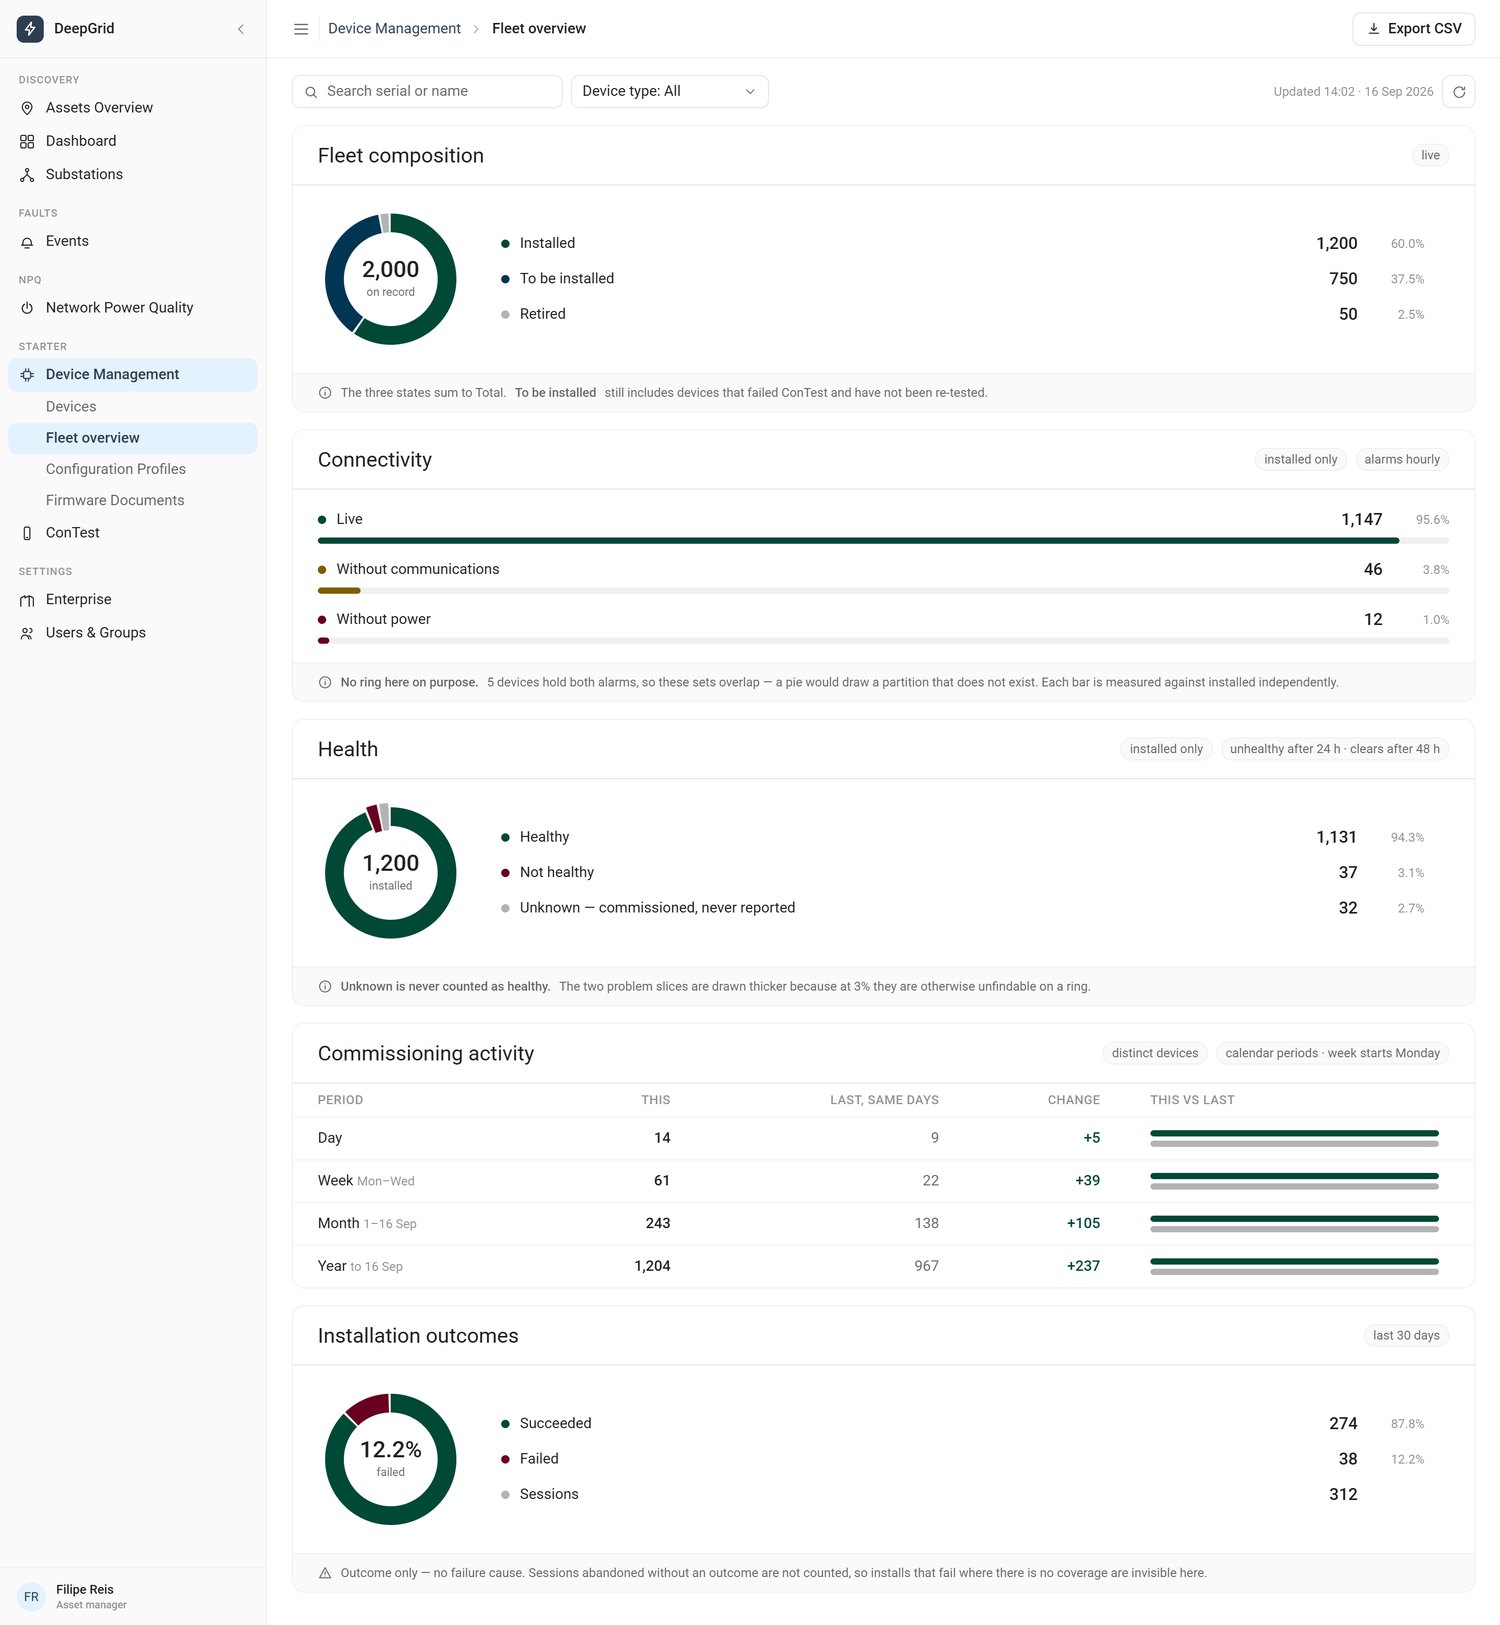
"Showing 1,131 healthy devices tells no one what to do. Showing 37 unhealthy ones, first, does."
Goals
Lead with what needs attention. The count of unhealthy devices is the number someone acts on, so it comes first.
Make small numbers findable. Most problems here are 1–4% of the fleet. The chart type has to keep them visible.
Never draw a partition that doesn't exist. Connectivity issues overlap. The page can't suggest they add up.
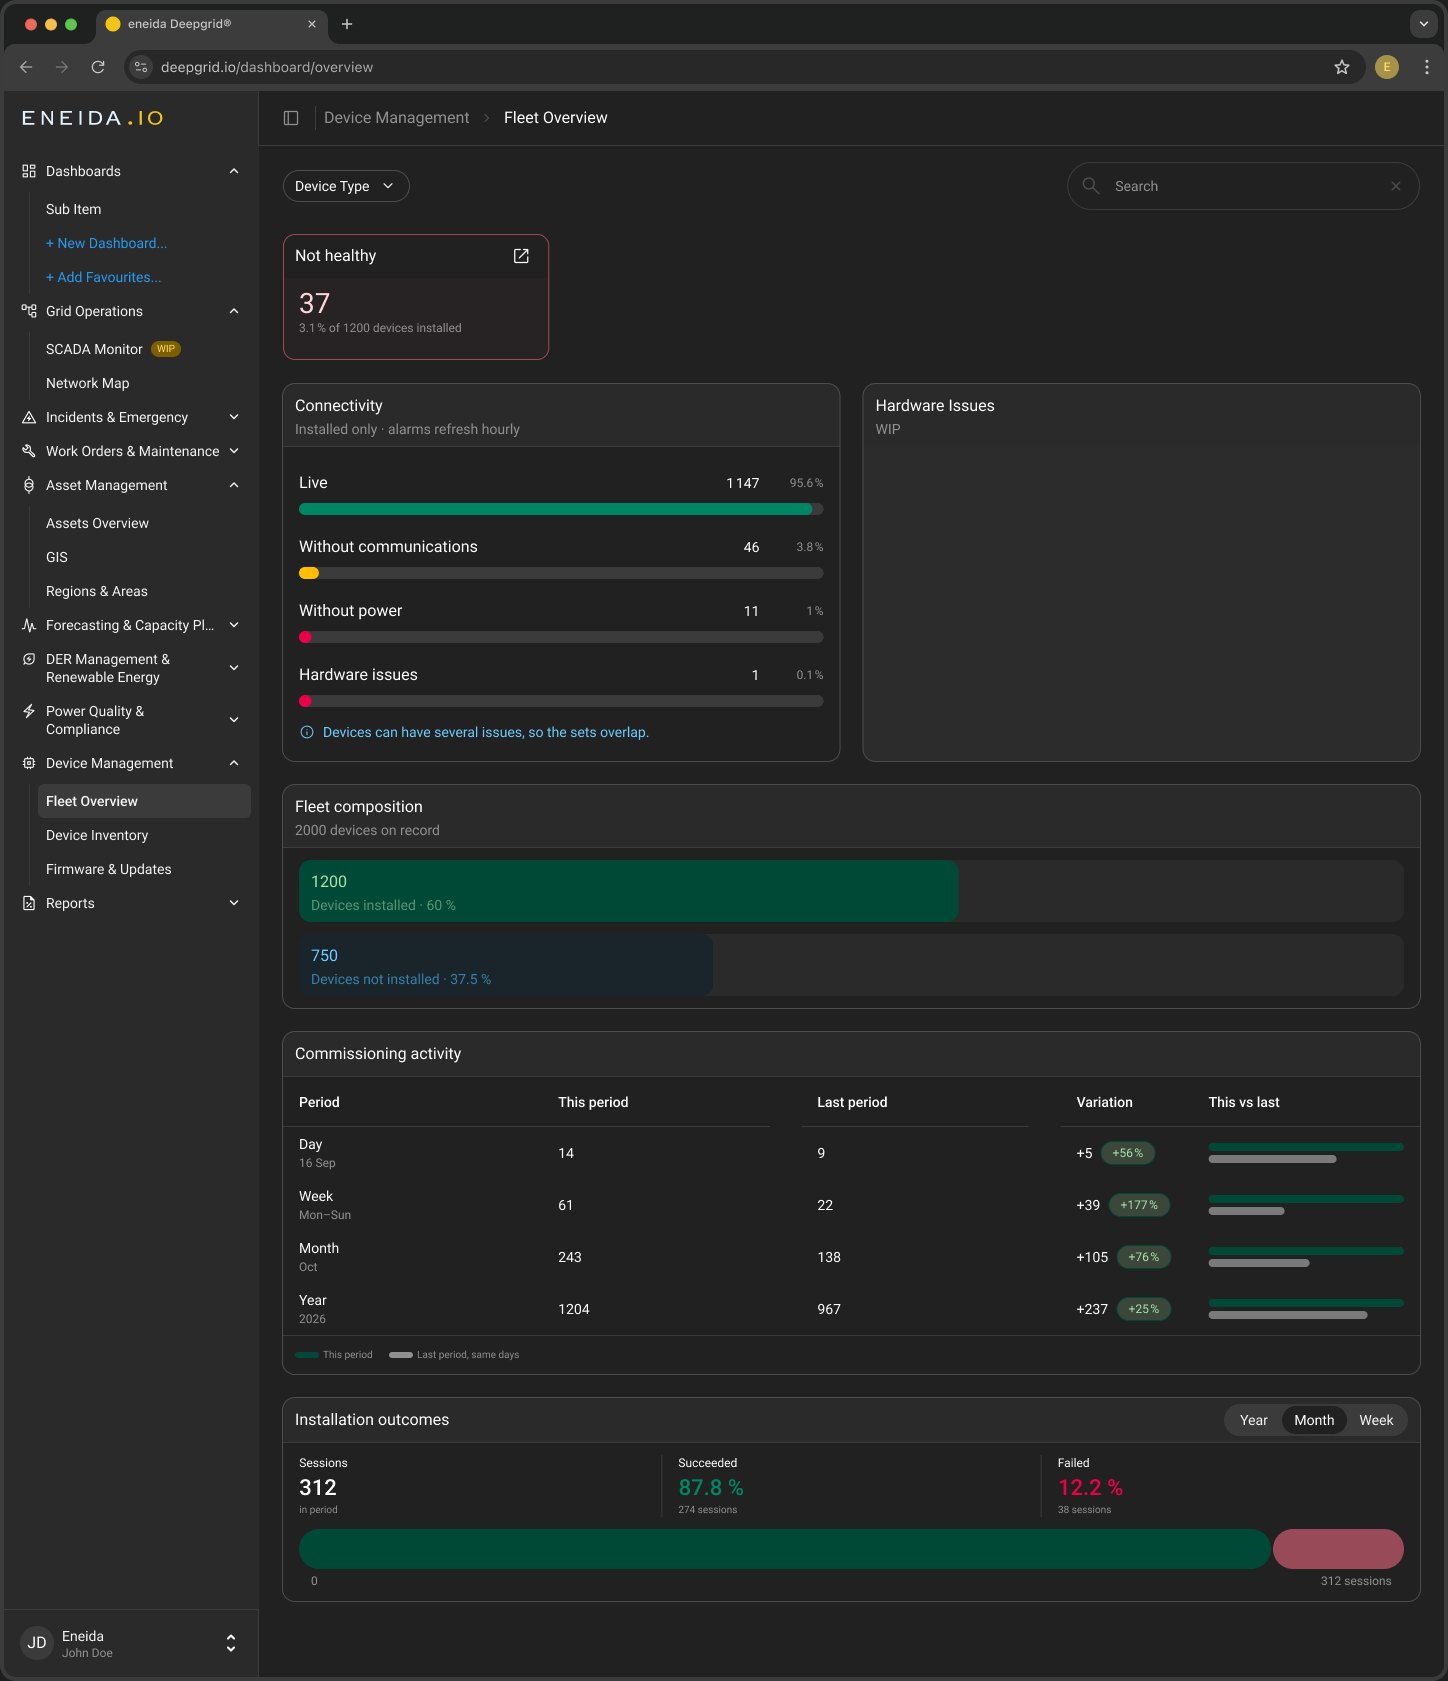
Speak DeepGrid. Existing cards, chips, segmented buttons, search and filter, in both themes.
Work at three widths. Desktop, a 744 tablet and a 414 phone, with the same content in the same order.
Approach
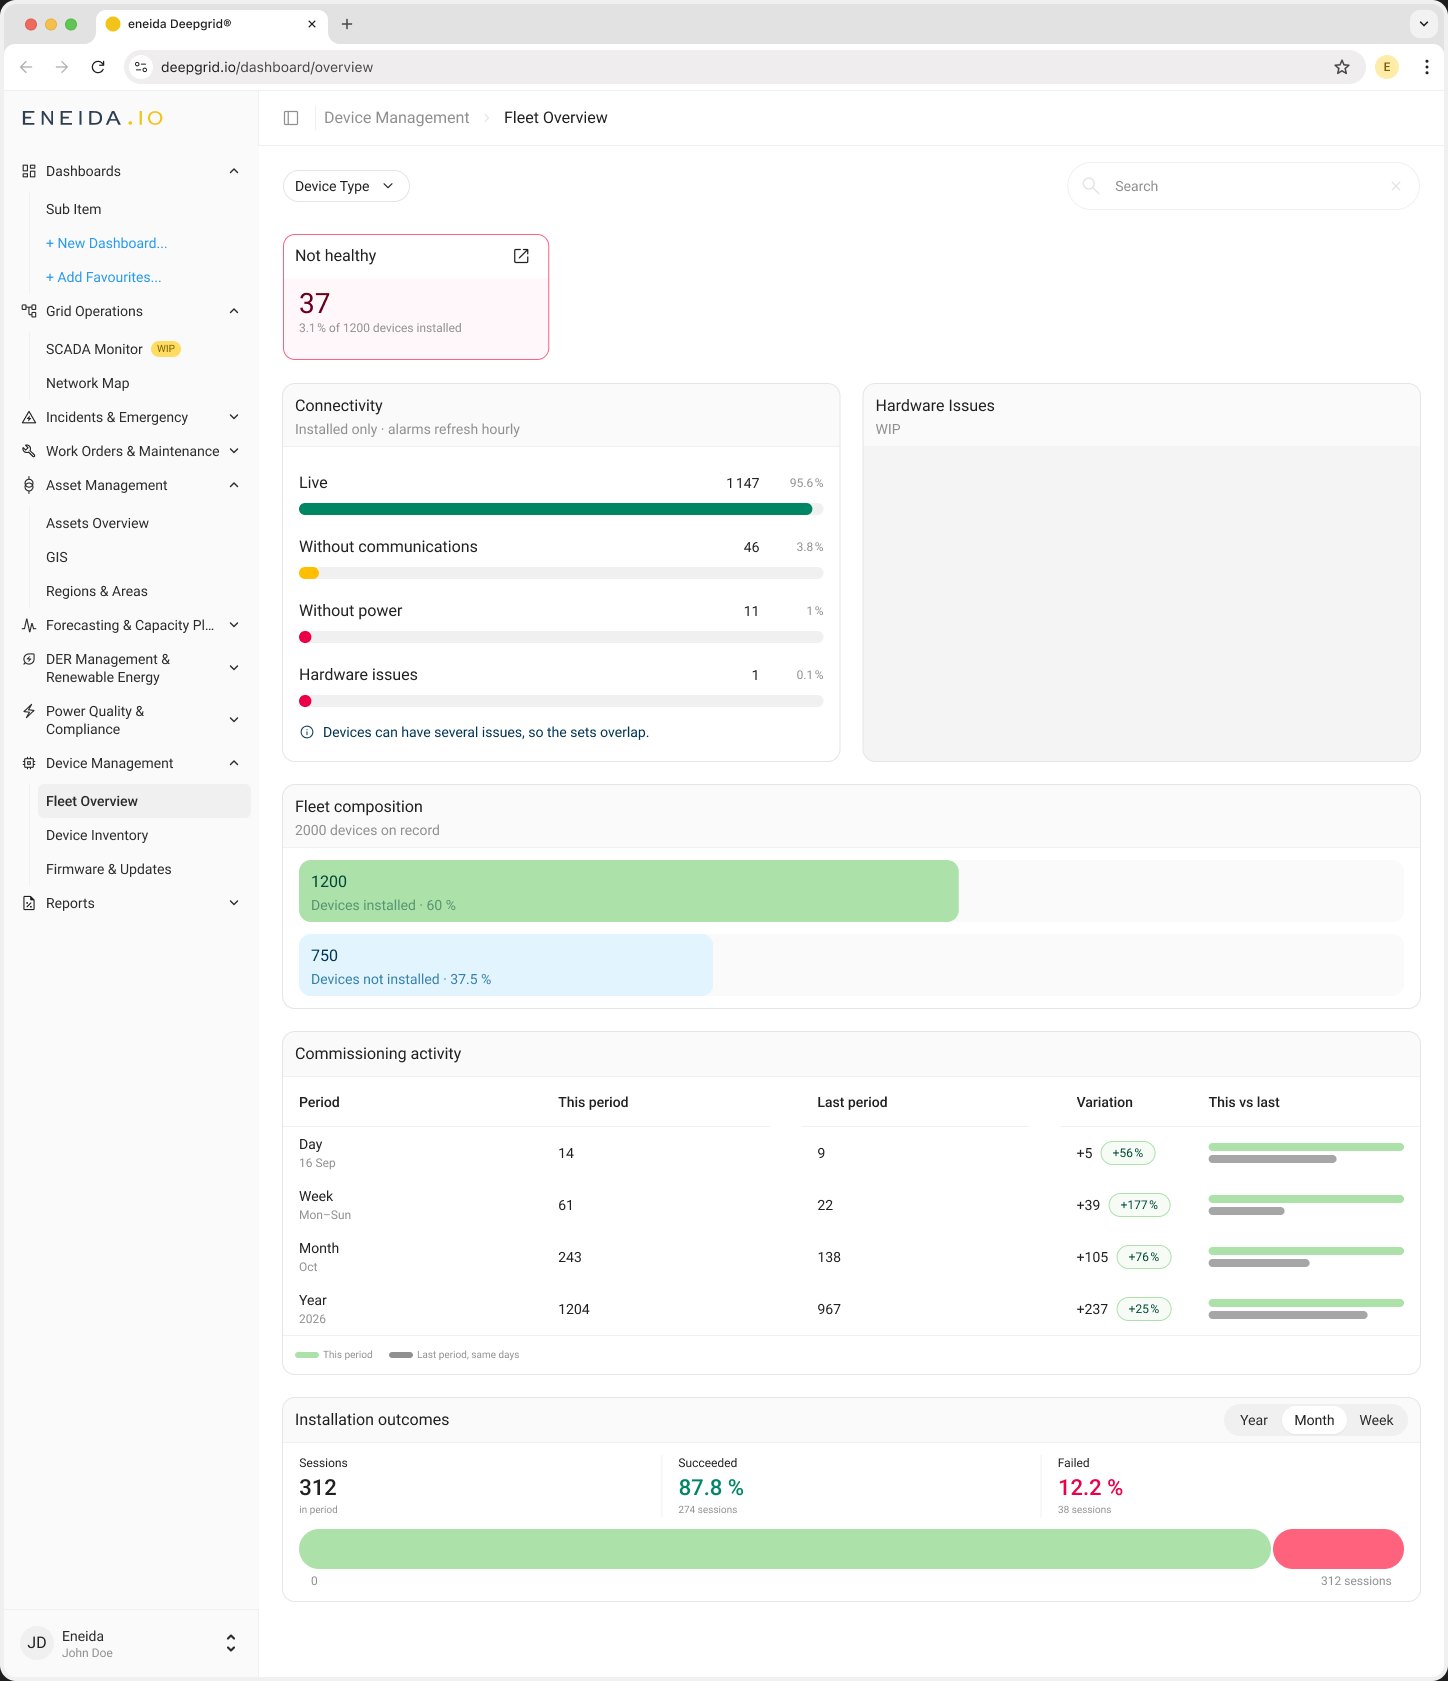
Lead with the exception. Health was a ring that was 94% one colour, with the 37 devices that matter as a sliver. The final design keeps only the number someone acts on: a tinted “Not healthy” card at the top of the page, with its share of installed devices and a link to the list.
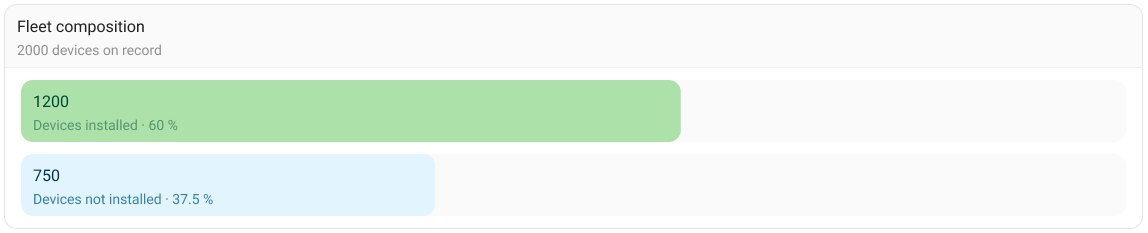
Bars all the way down. Every proportion on the page became a bar measured against its total. Fleet composition is two bars against all devices on record, each labelled with its count and share. One chart type across the page means one way of reading it.
Overlapping sets, said plainly. Connectivity kept its bars against installed devices, with a new Hardware issues row. The mock's footnote became one line anyone can read: “Devices can have several issues, so the sets overlap.”
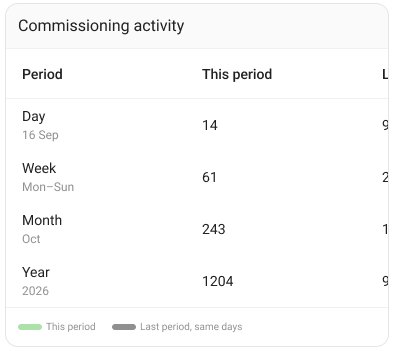
Show the change as a rate too. The commissioning table was already the right shape. It gained a percentage chip next to each absolute change (+39 is +177%), and a legend naming this period and last period over the same days.
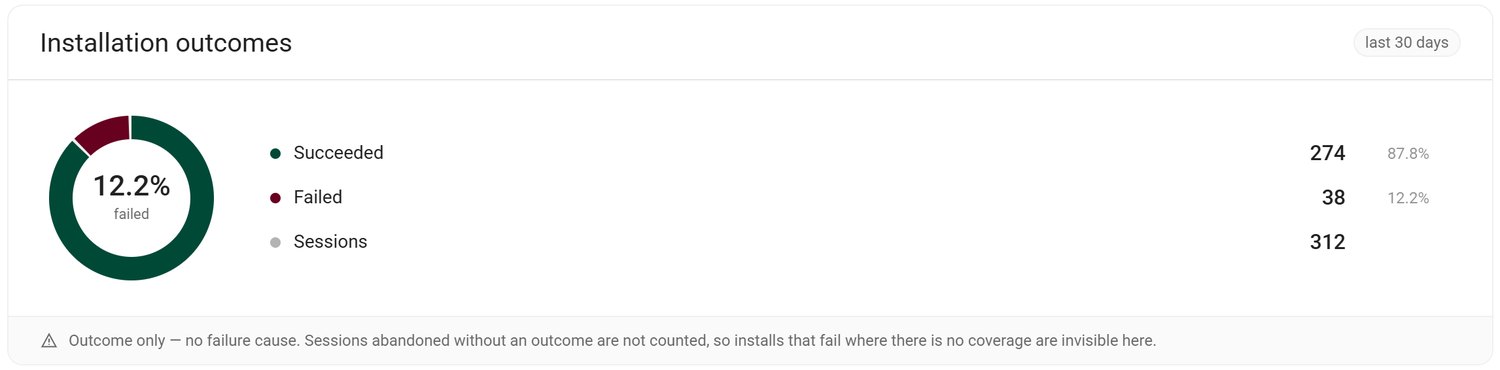
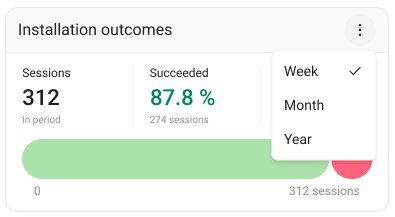
Three numbers, one bar, any period. The outcomes ring became sessions, succeeded and failed as figures over a single bar split by result, with a Year · Month · Week switch where the mock was fixed to the last 30 days.

Breakpoints
The content order never changes across desktop, tablet and phone; what changes is how much room each control gets. On tablet the sidebar becomes an icon rail; on phone, navigation goes behind a menu, the commissioning table scrolls inside its card, and the period switch folds into a menu.
Final design
The exception first, then connectivity and hardware issues side by side, then the shape of the fleet and how fast it's growing, in light and dark.