This case study is password protected
Enter your personal password below, or request access if you don't have one yet.
That password isn't right — try again, or request access below.
Request access →Load, measured against the limit that actually applies
Context
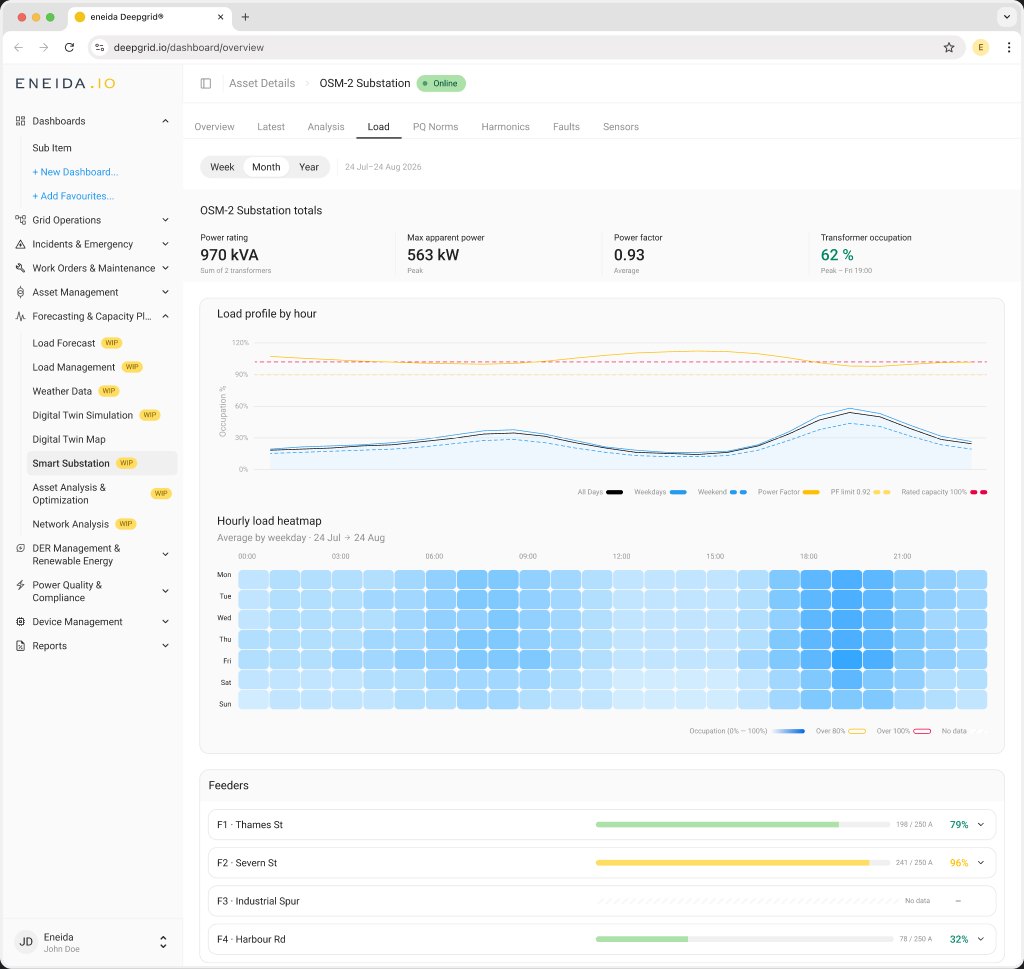
DeepGrid monitors low-voltage substations for electricity distribution networks. Each substation has one or more transformers, and each transformer feeds several feeders, the cables that run out to streets and customers. Every one of those assets has a rating: a transformer's capacity in kVA, a feeder's fuse size in amps.
The existing screens showed load as absolute numbers, one asset at a time. An operator could read that a feeder carried 241 A, but nothing on the screen said whether 241 A was comfortable or nearly at its fuse.
Problem
A utility customer's request, approved in October 2024, had sat for almost two years without an engineering ticket. It named two gaps: no transformer rating anywhere near the load, and a feeder limit line that defaulted to 250 A whatever the feeder actually was. Tracing that number showed it was the default of a fuse-rating constant in the platform's simulation parameters, while the real commissioned fuse size sat unused.
"A wrong limit is more dangerous than a missing one: a missing line prompts a question, a wrong line prompts a decision."
Goals
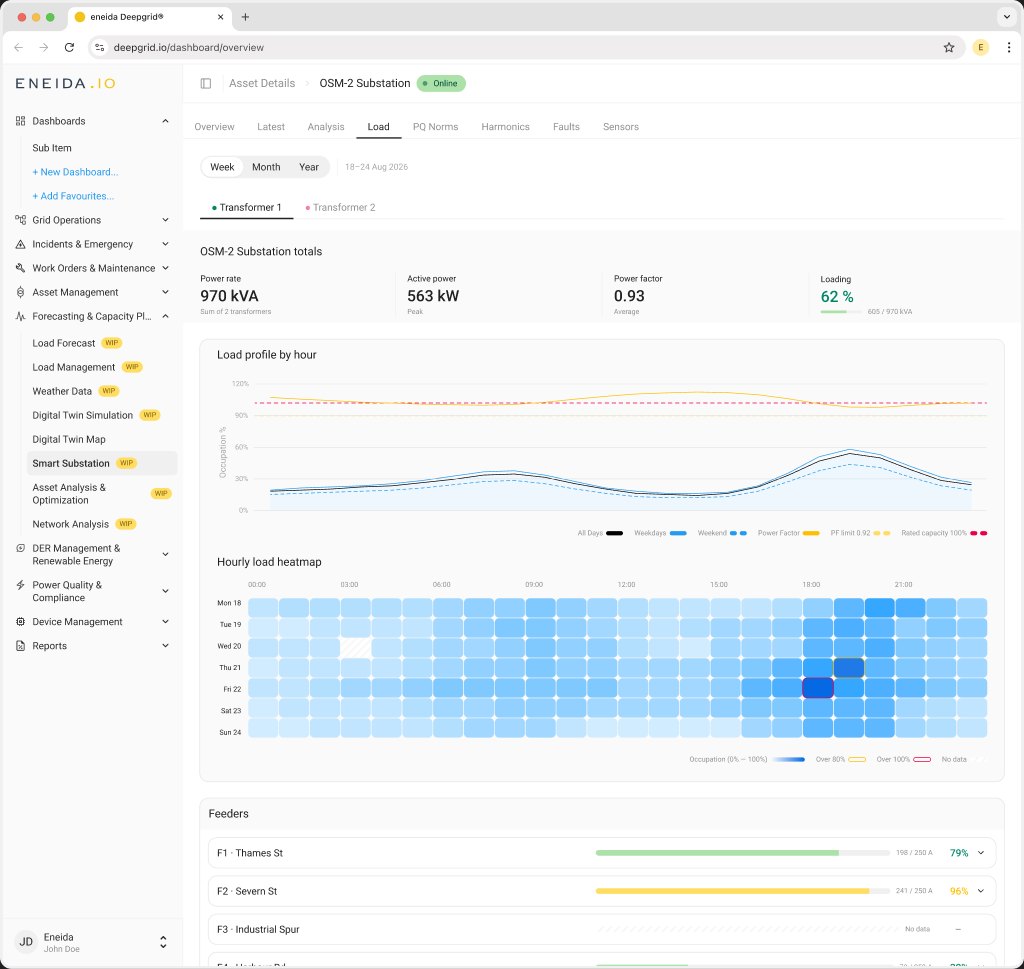
Show the whole substation without navigating. Two transformers and eight feeders should all be visible on one screen.
Make assets of different sizes comparable. A 250 A feeder and a 630 kVA transformer can only be compared at a glance as a percentage of their own rating.
Make the loaded parts findable. If one feeder is near its limit and the rest are quiet, that feeder is what the eye lands on first.
Never invent a limit. With no commissioned rating, the view says "no limit configured" and draws nothing.
Approach
Parked an accordion of transformers. The first layout nested feeders under collapsible transformer rows. It hid the overview behind clicks, and split load between transformers that physically share one busbar.
Let the bar coupler decide the shape of the tab. With the coupler closed (Interbars), the substation is analysed against the sum of its transformer ratings. With the bars apart (Single), each transformer gets its own tab and there's no substation overview. Feeders are always measured against their own fuse.
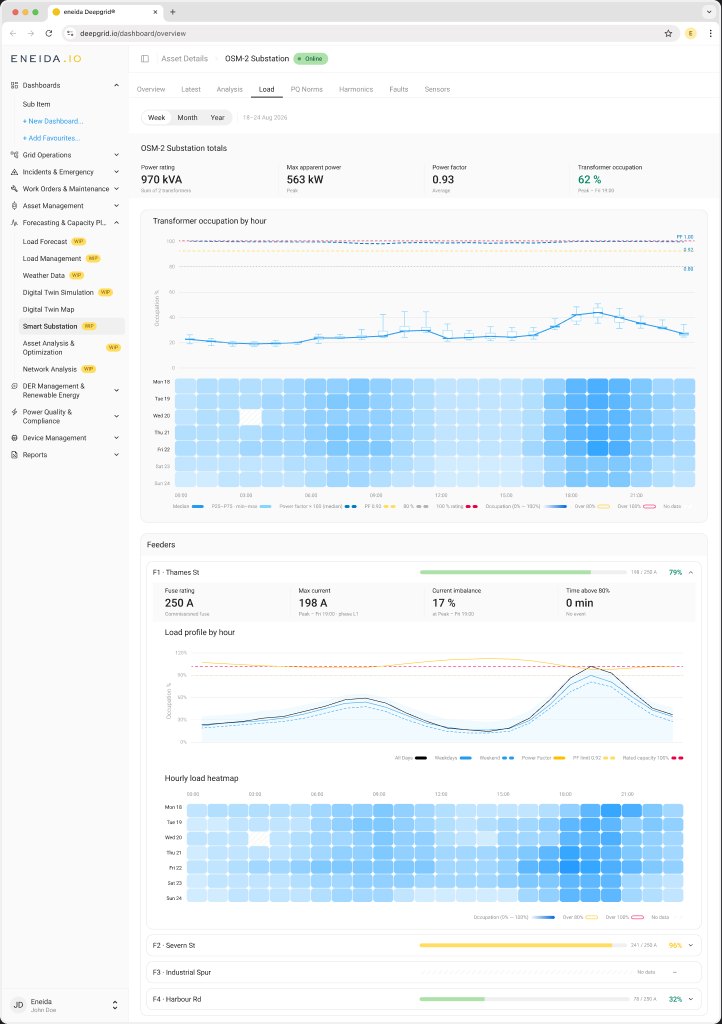
Colour carries magnitude, outlines carry limits. The heatmap uses one blue in 5% steps; crossing 80% or 100% is drawn as a yellow or red rule around the cell, so the threshold stays visible even on a dark cell.
Kept weekdays and weekends apart. Averaged together, the quiet weekend pulls the weekday peak down by roughly a fifth, and that peak hour is the whole reason to look.
Replaced a smoothed line with a box plot. The median with P25–P75 boxes and min–max whiskers per hour shows both the typical hour and the worst one.
Critique
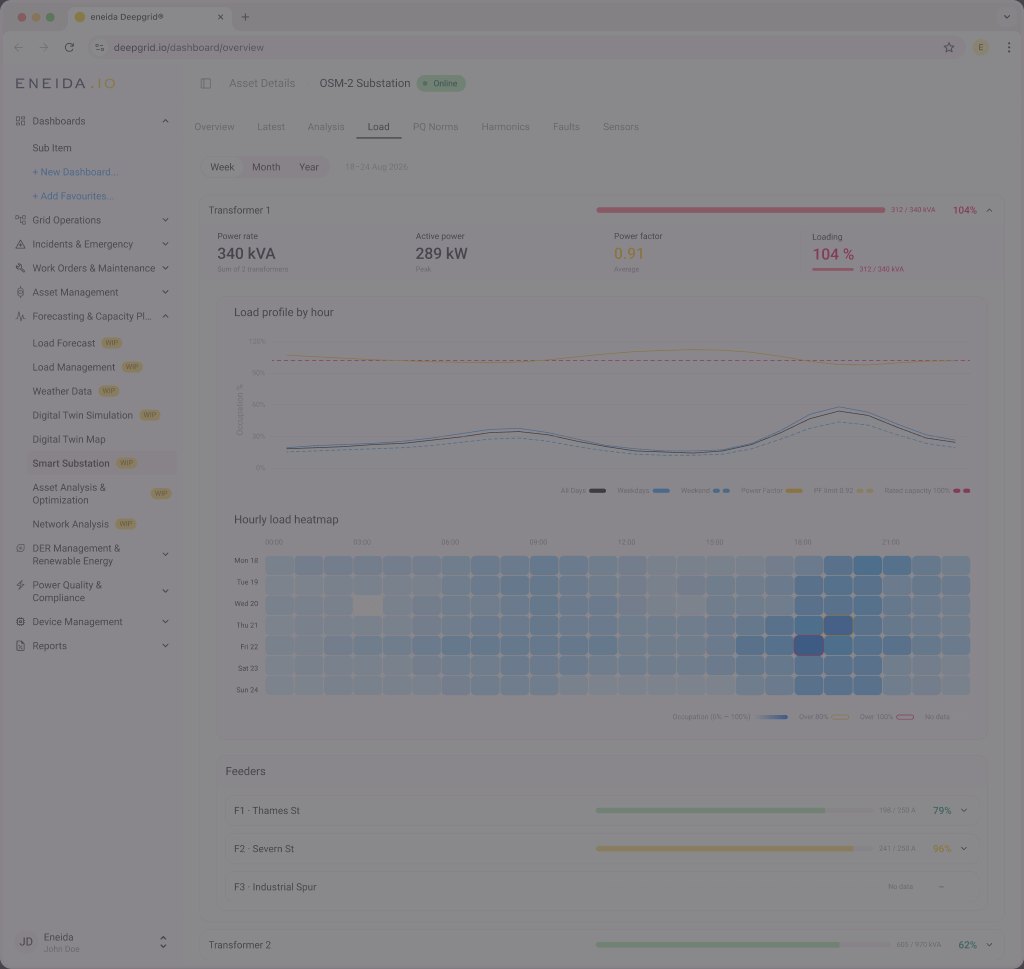
The critique round kept the layout and charts. Most changes landed in the counters, naming each number for what it measures: "Loading" became Transformer occupation, and the feeder card stopped reusing transformer labels, so a value in amps now sits under Fuse rating, marked as the commissioned fuse.


Final design
Counters first, then when the load happens, then which feeder carries it. Each feeder opens into the same analysis, measured against its own commissioned fuse.